This page lists details about the dwv architecture.
Layers
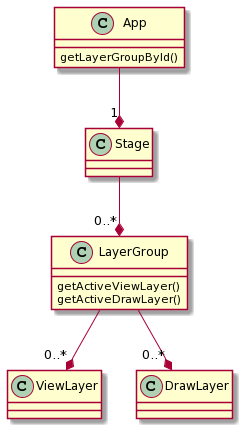
The first level is the stage, this class handles a list of LayerGroups for optional synchronisation. A layerGroup is
a group of layers associated to an HTML element, for now of type View and Draw. The configuration of the stage
is done at the creation of the app. See app::init method for details. Each layer class will
create its own HTML div with an id created by dwv::gui::getLayerGroupDivId. Layers
will typically contain a HTML canvas to display its content. Use the dwv::gui::getLayerDetailsFromEvent method to extract the layer details from an event generated from a layer canvas.
You can then access the layer object via the app getLayerGroupById method.
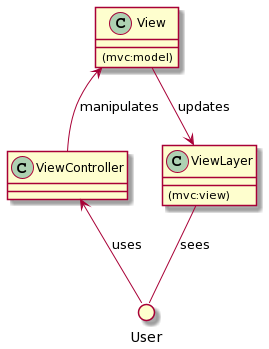
The View class contains a 2D view of the image that could be 3D + t. Layers follow the model-view-controller (MVC) design. In the view case, the model is the View, the view the ViewLayer and the controller the ViewController.
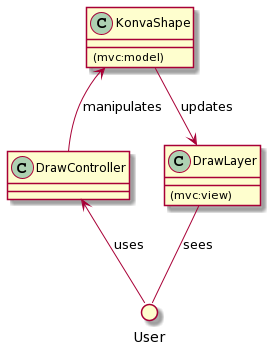
In the case of the draw, the model is the KonvaShape, the view is the DrawLayer and the controller is the DrawController. The shape will use the ViewController for quantification when it needs to access the underlying pixel values.
Data load
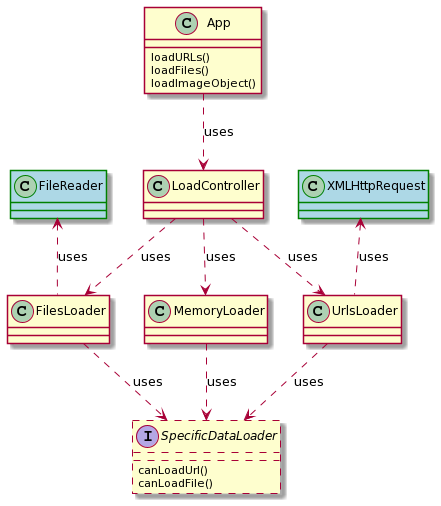
Data can come from 3 types of source: url (via a XMLHttpRequest), file (via a FileReader) or directly as a memory buffer. The 3 'meta' loaders responsible for each source are: UrlsLoader, FilesLoader and MemoryLoader.
Each 'meta' loader will then delegate the individual data load to a specialised loader according
to its answer to the canLoadUrl or canLoadFile call. The current specialised loaders are:
- DicomDataLoader: reads DICOM dataIndex
- JSONTextLoader: for JSON data
- RawImageLoader: for image formats supported by the browser
- RawVideoLoader: for video formats supported by the browser
- ZipLoader: for data compressed in a ZIP file
View creation
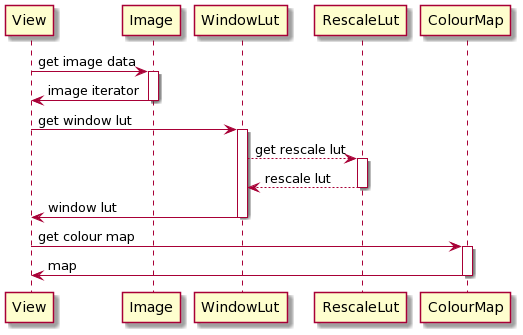
The library will use a series of steps and LookUp Tables (LUT) to convert the file data into the canvas array data:
- Extract the data from the recreated 3D volume using position and orientation and abstracted folowing the iterator pattern (see image/iterator.js)
- From stored type range to physical range using a Modality LUT: rescale slope and intercept are used
in the conversion equation:
y = slope * x + intercept(see image/rescaleLut.js) - Select part of the range using a VOI LUT (Value Of Interest): window width and level (or centre) allow to focus on a specific range (especially useful for normed data such as in CT) (see image/windowLut.js)
- Assign a colour to each values using a colour map (see image/lut.js)
- You now have the canvas data!
All this is materialised in the dwv.image.generateImageData* functions.